Relative Strength Index
The Relative Strength Index (RSI) attempts to identify overbought and oversold scenarios for individual stocks or the market as a whole. Used in Technical Analysis, the RSI is a momentum indicator that measures the magnitude of price movements. The RSI oscillates between 0 to 100.
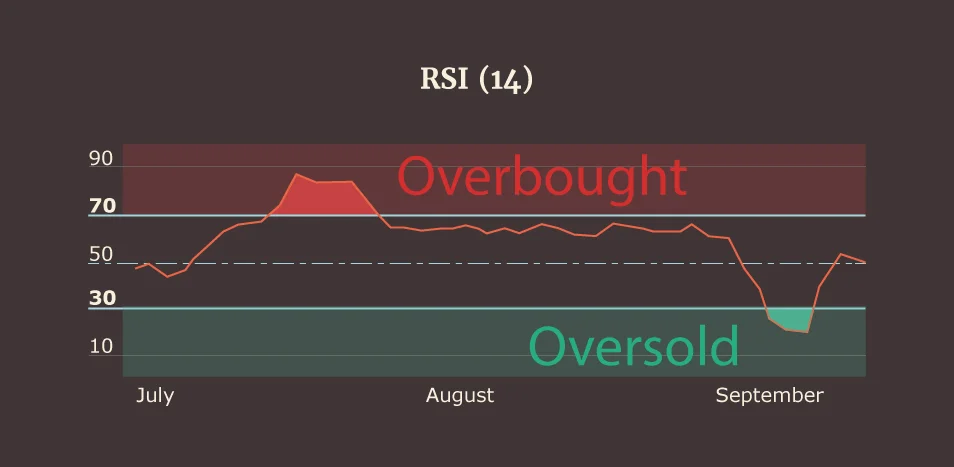
As a rule of thumb, values over 70 suggest overbought conditions and suggest selling opportunities. Values under 30 suggest oversold conditions and suggest buying opportunities. As shown by the following example, this stock reached an overbought scenario in late July and an oversold scenario in mid-September.

My Take
The RSI can be a valuable indication of buying and selling opportunities, but using the indicator by itself can be dangerous, as it does not factor in Fundamental Analysis or other Technical Analysis data.

